Encoding Numerical Features| Discretization| Binarization
Introduction
As the name suggests, we are going to talk about Numerical features. If you are not much aware about
this then you might be thinking that why we are encoding numerical features is because we provide
numerical features to machine learning algorithms but here we are encoding it. There are cases where
when we encode numerical features it helps in improving the performance of the machine learning
algorithms.
If it is a bit confusing for you then read the complete article. We will be looking at the topics with the
example so, it will clear all your doubts.
Before going into detail, let’s understand this with the example. Suppose we have the age of some
people and let’s see how encoding works.
Next, we have total runs of players in cricket and see how we encode it.

In the above example, we have made an interval of age the same as in Histogram and write down the
frequency of the numbers occurring in the dataset.

In the above example, the left side Runs scored is given in a column and now after encoding it it will
look like the table on the right side(in the above picture).
After two examples, now you have some idea about it. Now let’s talk about it in detail.
Techniques
There are two techniques for encoding numerical features:-
Discretization (Binning)
Binarization
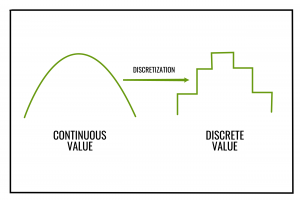
Discretization
Discretization is the process of transforming continuous variables into discrete variables by creating a set of contiguous intervals that span the range of the variable’s values. Discretization is also called Binning, where bin is an alternative name for interval.
Why use Discretization?
To handle outliers.
To improve the value spread i.e., spread of data.
Types of Discretization
There are different types of Discretization :-
Equal Width (Uniform)
It is called Equal width or uniform because the width of the interval is the same or uniform.
The width of the interval is calculated by the formula given in the picture below.
Suppose, we have the age data of some people and the maximum age in the data is 100 and minimum
is 0. Let’s take no. of bin is 10 then the width of the interval will be 10.
Here, the graph will be Histogram which has 10 bins and width is alsos 10.

It is used because :-
It handled the outliers as outliers came into the last bin.
No change in the spread of data.
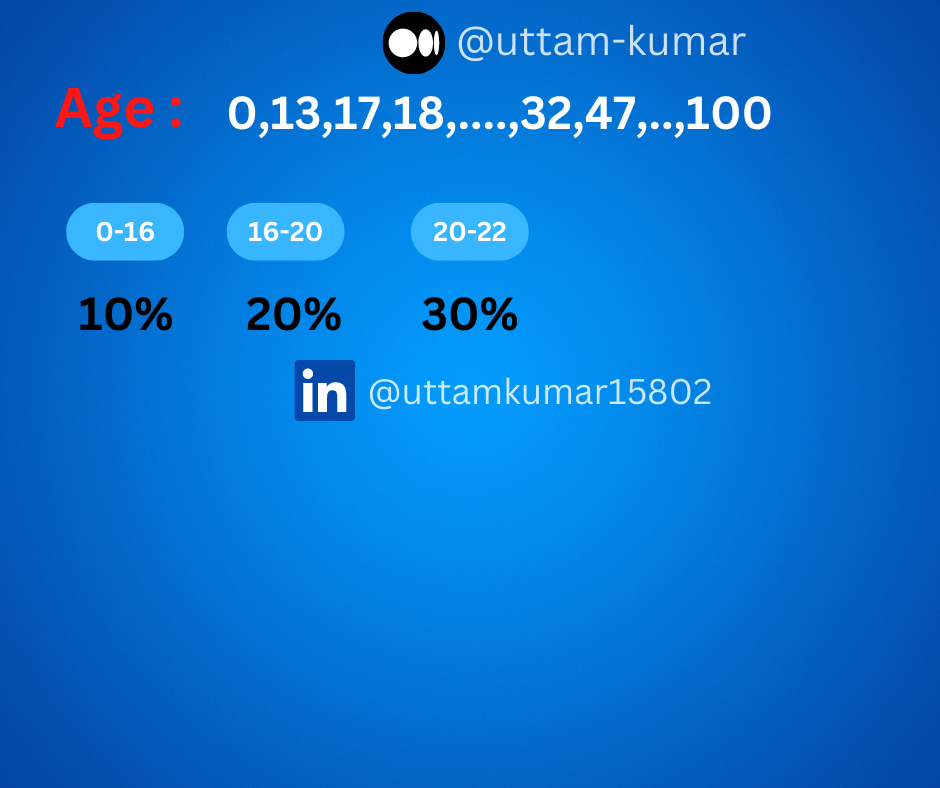
Equal Frequency (Quantile)
It is also known as Quantile binning. Here, we talk about the quantiles like 10 percentile, 20 percentile.
The width of the interval is not the same as in equal frequency.
Let’s understand this with the help of an example. Suppose the above example of age data.
In Quantile Binning, let’s say we want 10 percentile.
The age width where 10 percentile lies like here is 0-16 then again 10 percentile i.e., 16-20 and if we
start from 0-20 then it will be 20 percentile. Now, 20 -22 will be 10 percentile but from 0-22 will be 30
percentile.
Each interval contains 10% of total observations.
Why to use equal frequency :-
Works better for outliers.
Improve the value spread.
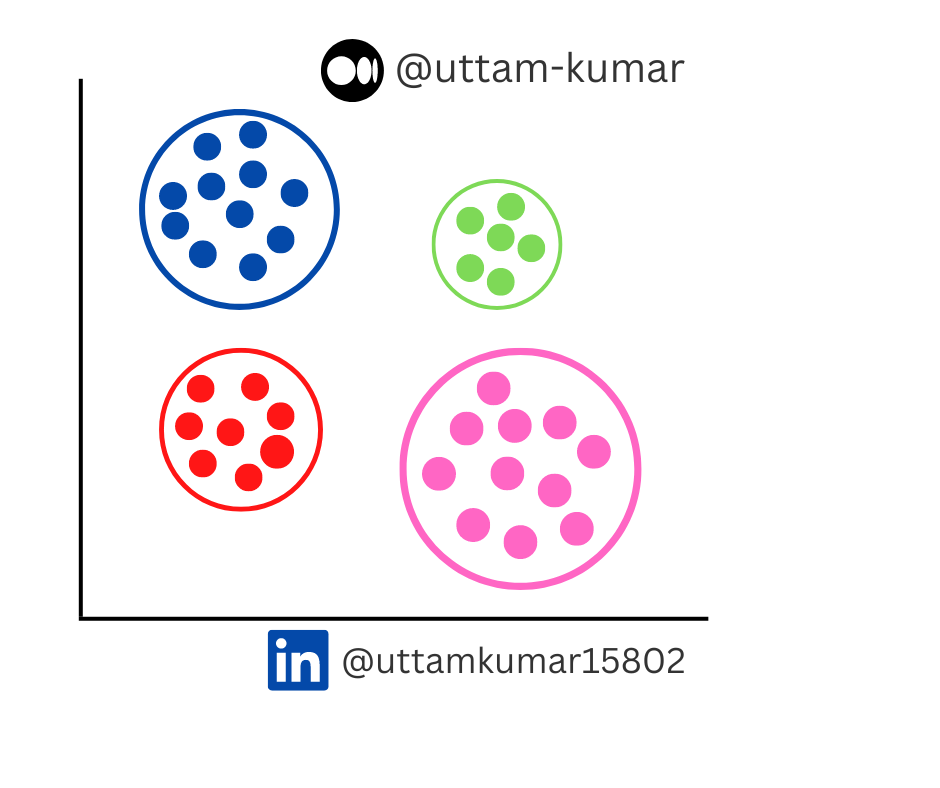
K means binning
I hope you know K means clustering techniques which make clusters. An image has been attached
below to make your understanding better.
Below image graph is in 2D so we can easily classify the clusters but if it is in 10D or in nD then also
this algorithm can make clusters.
K means Binning is used when the data is in clusters, like let’s take an age example. Suppose we have
age i.e., 10-16 ,22-28, 34-40. Age of the person is in clusters so we can apply this binning on these
types of data.
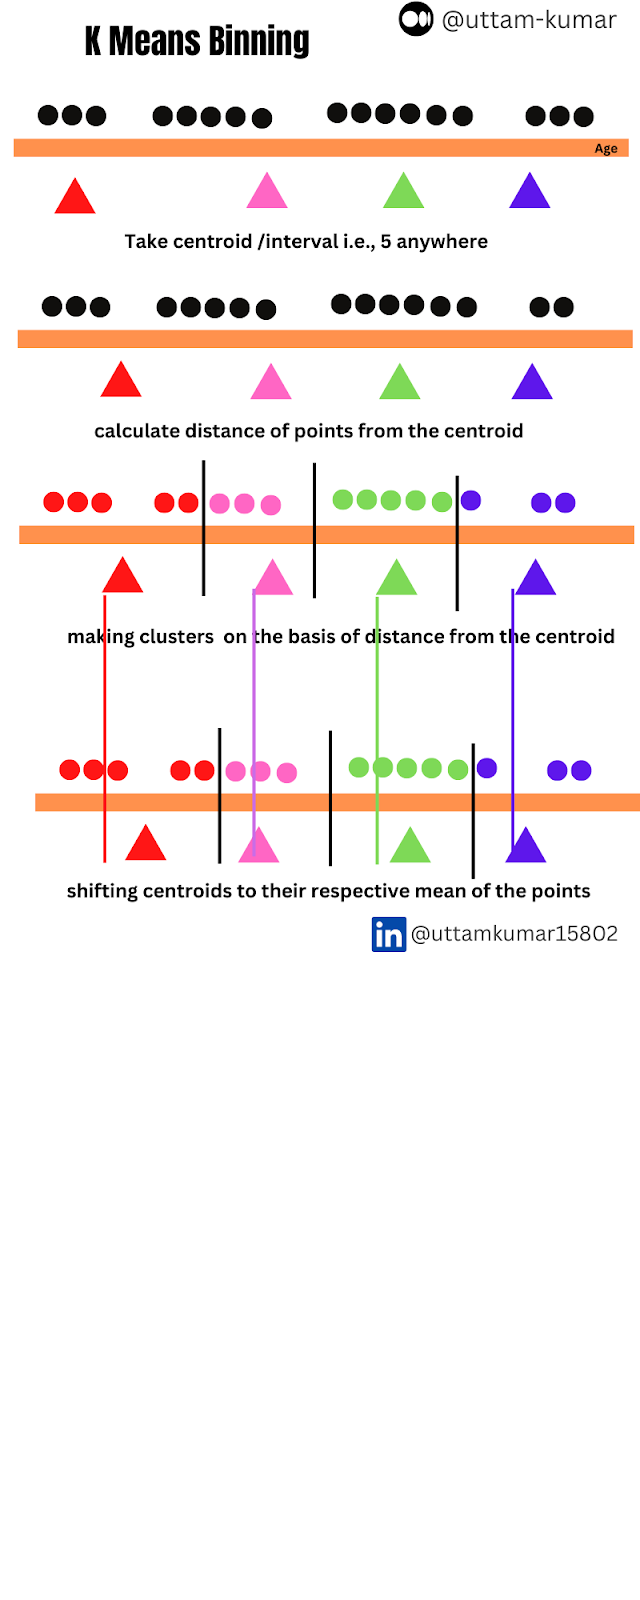
How does K means Binnig works ?
Let’s understand this with the help of an age example :-
Suppose we want 4 centroid ie., intervals. So, we will take centroids anywhere.
Now, calculate the distance between the points and the centroids.
Make the clusters of the point with the centroids which have the shortest distance with the point.
You can see in the below image all clusters are indicated with different colors.
After making the clusters, we will move the centroid to the mean of the points.
Custom Binning
Custom Binning is also known as the Domain based binning. In custom binning domain knowledge is
used to encode numerical features. The way or procedure of the encoding numerical feature can be
different from domain to domain.
This binning is performed on the basis of domain experience. In custom binning there is no set of rules
on how to encode numerical features. You have to decide on the basis of your requirement and
knowledge & experience.
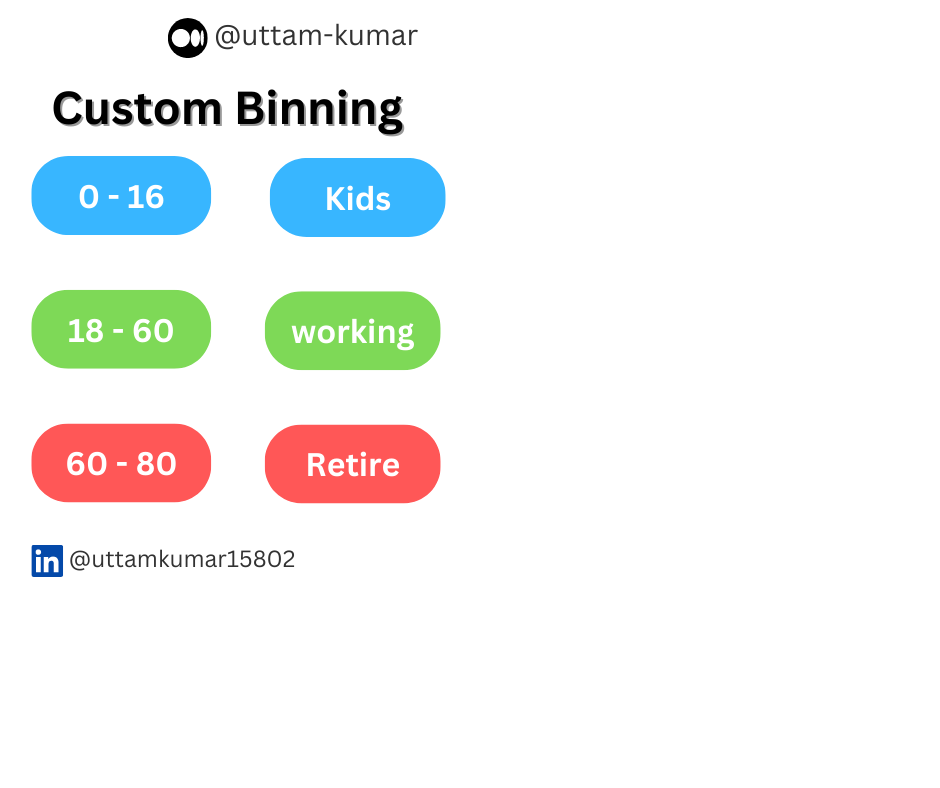
Let’s understand this on the basis of the age example.
Here, the age is classified in the below picture. 0 -16 age are kids, 18-60 are the working people. 60-80
are retire.
Binarization
In binarization, features are transformed in the binary numbers.
Let’s understand this with the help of an image processing example.
You have a color picture and you have to make it black and white. The threshold number is 127.5. The
pixel which has lower value than this threshold value will be assigned with 0 i.e., white and the pixel
which has higher value then threshold then it will be assigned with 1 i.e., black.
The data is transformed into 0 and 1. So, that’s how binarization works.
Conclusion
We know how to encode the numerical features using discretization and binarization. You can perform
this discretization and binarization by using sklearn.


0 Comments
If you have doubt, let us know...